obsidian-vault-dashboard
Vault Dashboard - Interactive Obsidian Knowledge Graph Plugin
Website · Getting started · Features · Documentation
Live Demo: https://outblade.github.io/obsidian-vault-dashboard/demo.html
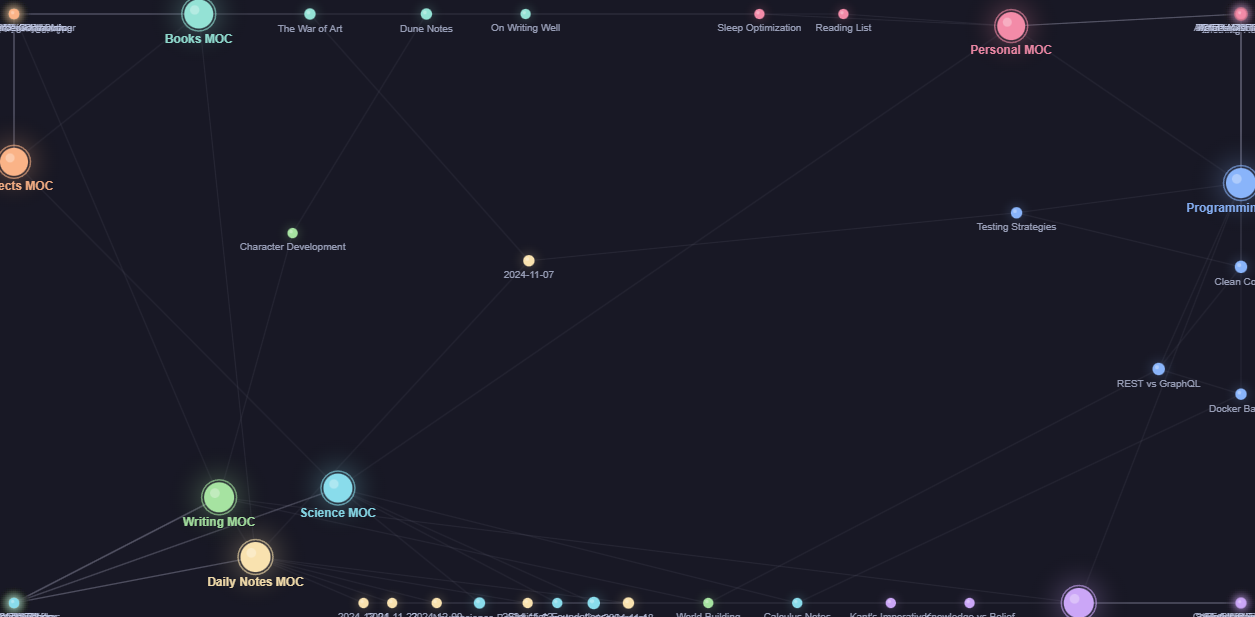
An Obsidian plugin that turns every new tab into a live analytics dashboard. Visualize your entire knowledge base as an interactive force-directed graph, track writing progress with real-time stats, explore your most-used tags, and navigate recently modified notes — all without leaving Obsidian.
Features
- Interactive Knowledge Graph: Force-directed graph with topic clustering — notes in the same folder attract each other into visible clusters
- Live Vault Stats: Real-time note count, estimated word count, total links, and unique tag count
- Tag Cloud: All tags scaled and weighted by frequency across your vault
- Recently Modified: The 10 most recently touched notes with relative timestamps and one-click navigation
- Drag and Zoom: Drag nodes to reposition, scroll to zoom, pan freely across the graph
- Hub Detection: MOC and highly-connected notes are automatically larger and ringed
- Topic Filtering: Click any legend entry to dim or hide an entire topic cluster
- Node Tooltips: Hover any node to see note name, topic, connection count, tags, and word count
- Open Notes Directly: Double-click any node to open that note in Obsidian
- Auto-Refresh: All panels update automatically as you create, delete, or rename notes
- Configurable: Adjust max graph nodes and label visibility from plugin settings
Live Demo
Try the browser simulation now: Vault Dashboard Live Demo
What you can do:
- Explore an 88-note synthetic vault across 8 topic clusters
- Drag nodes and watch the physics simulation react
- Scroll to zoom in on dense clusters and read node labels
- Click legend entries to isolate or hide topics
- Double-click any node to inspect its metadata
- Hit “Simulate Writing” to watch notes get added in real time
Technology Stack
- Frontend: TypeScript, HTML5 Canvas API, CSS3
- Physics Engine: Custom force-directed simulation (repulsion + spring + clustering forces)
- Obsidian API: MetadataCache, Vault events, ItemView, Plugin settings
- Build Tools: esbuild, Node.js, npm
- Deployment: GitHub Pages (browser demo)
Installation
Prerequisites
Quick Start
# Clone the repository
git clone https://github.com/OutBlade/obsidian-vault-dashboard.git
cd obsidian-vault-dashboard

# Install dependencies
npm install

# Build the plugin
npm run build
Copy the three output files into your vault’s plugin folder:
cp main.js manifest.json styles.css "<YourVault>/.obsidian/plugins/vault-dashboard/"
Then in Obsidian: Settings → Community plugins → enable Vault Dashboard
A grid icon appears in the ribbon. You can also open it via the command palette: Open Vault Dashboard.
Development Mode
# Watch for changes and rebuild automatically
npm run dev
Usage
Opening the Dashboard
// The plugin registers a ribbon icon and a command
// Ribbon: click the grid icon in the left sidebar
// Command palette: "Open Vault Dashboard"

// The view opens as a new tab and stays in sync with your vault
Interacting with the Graph
// Drag a node to reposition it — physics resumes on release
// Scroll wheel to zoom in/out
// Click and drag the background to pan
// Double-click a node to open that note in Obsidian
// Hover a node for a metadata tooltip
// Click a legend color to dim/hide that topic cluster
Plugin Settings
// Settings → Community plugins → Vault Dashboard → Options

const settings = {
  maxNodes: 150,      // Top-N notes by link count shown in graph
  showLabels: true,   // Toggle note name labels on the graph
};
Advanced Graph Configuration
// The force simulation uses three forces:
// 1. Repulsion — all node pairs push apart (prevents overlap)
// 2. Spring edges — linked notes attract each other
// 3. Clustering — same-topic notes softly attract each other

// Hub notes (MOCs, high-degree nodes) are automatically detected:
// radius = 9 + min(degree, 12) * 0.5
// Regular notes: radius = 4 + min(degree, 12) * 0.55
Project Structure
obsidian-vault-dashboard/
├── src/
│   └── main.ts           # Full plugin source (view, simulation, settings)
├── demo.html             # Standalone browser demo — no build required
├── styles.css            # Plugin stylesheet (uses Obsidian CSS variables)
├── manifest.json         # Obsidian plugin manifest
├── package.json          # npm dependencies and build scripts
├── tsconfig.json         # TypeScript configuration
├── esbuild.config.mjs    # esbuild bundler configuration
├── screenshot.png        # Dashboard preview
└── README.md             # This file
Roadmap
- Phase 1: Folder-based automatic topic coloring
- Phase 2: Graph timeline — animate how the vault grew over time
- Phase 3: Writing streaks and daily word count chart
- Phase 4: Orphan note detection and link suggestions
- Phase 5: Export graph as SVG/PNG
Contributing
Contributions are welcome! Here’s how to get started:
- Fork the repository
- Create a feature branch (
git checkout -b feature/your-improvement) - Commit your changes (
git commit -m 'Add your improvement') - Push to the branch (
git push origin feature/your-improvement) - Open a Pull Request
Development Setup
# Clone and set up
git clone https://github.com/OutBlade/obsidian-vault-dashboard.git
cd obsidian-vault-dashboard
npm install

# Start watch mode
npm run dev

# Copy output to your test vault
cp main.js manifest.json styles.css "<TestVault>/.obsidian/plugins/vault-dashboard/"
Code Style
- TypeScript strict null checks enabled
- Obsidian API types for all vault/workspace interactions
- Canvas rendering isolated in a single
draw()method - Force simulation in a pure function with no side effects
Related Projects
- Obsidian - The note-taking app this plugin is built for
- Obsidian Graph View - Obsidian’s built-in graph
- D3.js - Inspiration for the force simulation approach
- Dataview - Popular Obsidian data plugin
Acknowledgments
- Obsidian for the excellent plugin API and documentation
- D3.js for force simulation concepts and inspiration
- Catppuccin for the color palette used in the demo
- The Obsidian community for plugin development patterns and best practices
License
This project is licensed under the MIT License — see the LICENSE file for details.
Links
- Live Demo: https://outblade.github.io/obsidian-vault-dashboard/demo.html
- GitHub Repository: https://github.com/OutBlade/obsidian-vault-dashboard
- Obsidian Plugin Docs: https://docs.obsidian.md/Plugins/Getting+started/Build+a+plugin
- Report Issues: https://github.com/OutBlade/obsidian-vault-dashboard/issues
Made with passion by OutBlade
Tags: Obsidian plugin, knowledge graph, vault dashboard, PKM, note-taking, force-directed graph, second brain, Obsidian analytics